2017
Interface properties of nanoscale multilayers. — Artificial multilayers and hetero-structures of nanoscale layers are essential parts of information technology as well as many other technical applications. Since these multilayers are prepared by depositing layer by layer the appropriate amount of different atoms, the interface structure is determined by stochastic processes taking place at the actual, continuously changing surface of the structure. This way the width, the crystal structure, the atomic composition and the associated physical properties of the interface can be largely different when A atoms are deposited over a layer of B atoms or, vice versa, when B is deposited over A.
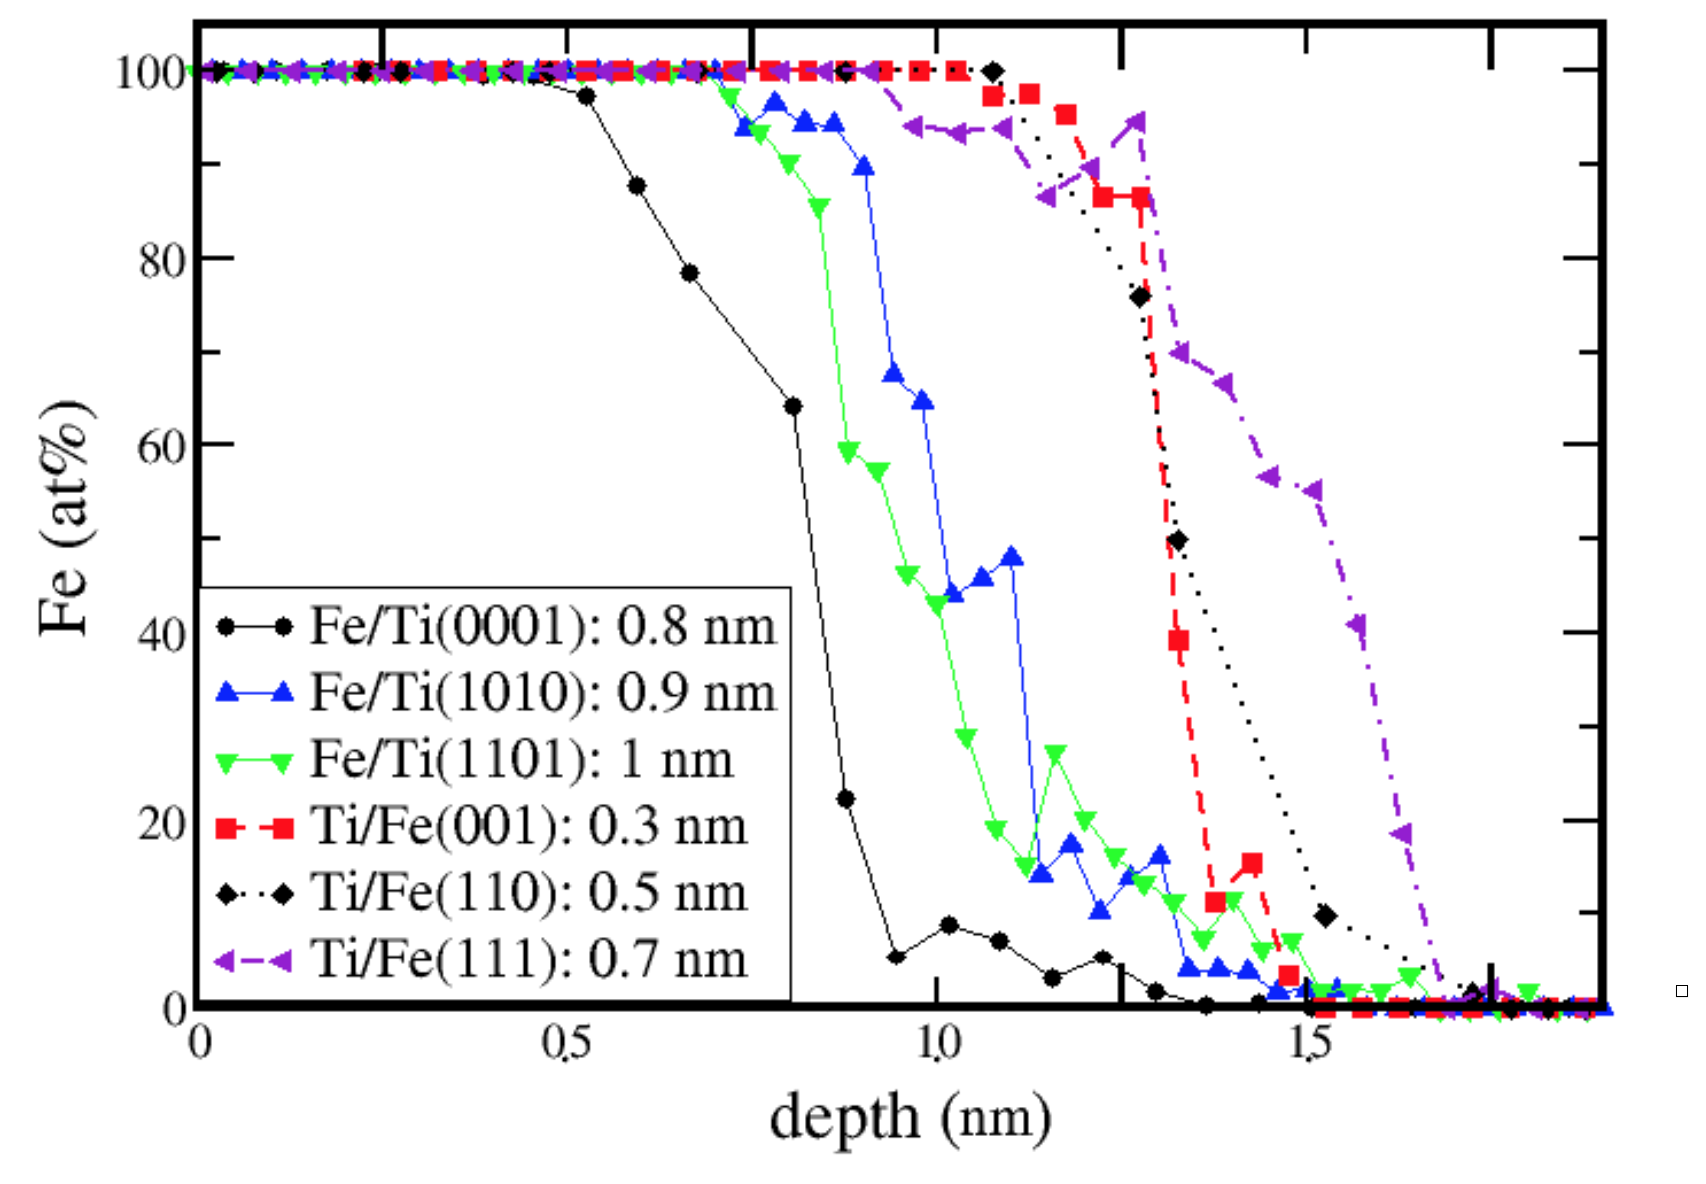
Figure 1. Concentration profiles across the Fe-on-Ti and Ti-on-Fe interfaces as calculated from MD simulations for different orientations of the substrate layer. The substrate orientations which belong to the different curves and the thickness of the respective interface alloy are indicated in the inset.
In our study, a significant difference of the Ti-on-Fe and the Fe-on-Ti interfaces are undoubtedly revealed both by molecular dynamics simulations of the layer growth (in collaboration with the Research Institute for Materials Science, Centre for Energy Research, HAS) and by experimental investigations. The calculated concentration depth profiles for different substrate orientations are displayed in Fig. 1. The Fe-on-Ti interfaces are slightly intermixed and the interface broadening depends on the orientation of the substrate, although the variation is small. In the Ti-on-Fe case, no atomic mixing can be seen for the Fe(001) substrate orientation, but the interface is slightly wavy which results in a 0.3 nm intermixing in the concentration depth profile. The largest intermixing takes place in case of the Fe(111) substrate orientation, but the interface width (0.7 nm) still remains below the Fe-on-Ti values. Altogether, from the simulations we can conclude that the intermixing is asymmetric with respect to the interchange of the constituents of the film and the substrate.
The experimental studies were made by conversion electron Mössbauer spectroscopy (CEMS) complemented by cross-sectional transmission electron microscopy (TEM) and X-ray reflectometry (XRR). The Ti/Fe/Ti trilayer samples were prepared by evaporation in high vacuum onto Si single crystal substrate using iron metal highly enriched in the 57Fe Mössbauer resonant isotope. In order to determine the phase fractions within the top (Ti-on-Fe) and bottom (Fe-on-Ti) Fe interface, Ti/57Fe/Ti/Si and Ag/57Fe/Ti/Si sample pairs were compared by exploiting the non-mixing property of Fe and Ag. Analyzing the spectra of Ag/57Fe/Ti samples provides information on the Fe-on-Ti interface, since the Ag/Fe interface is chemically sharp and the Ag layer causes only a small and well documented change in the hyperfine parameters of 57Fe within the atomic layers nearest and next-nearest to the Fe-Ag interface. Additional spectral components appearing in the Mössbauer spectra of Ti/57Fe/Ti samples reveal the specific properties of the Ti-on-Fe interface.
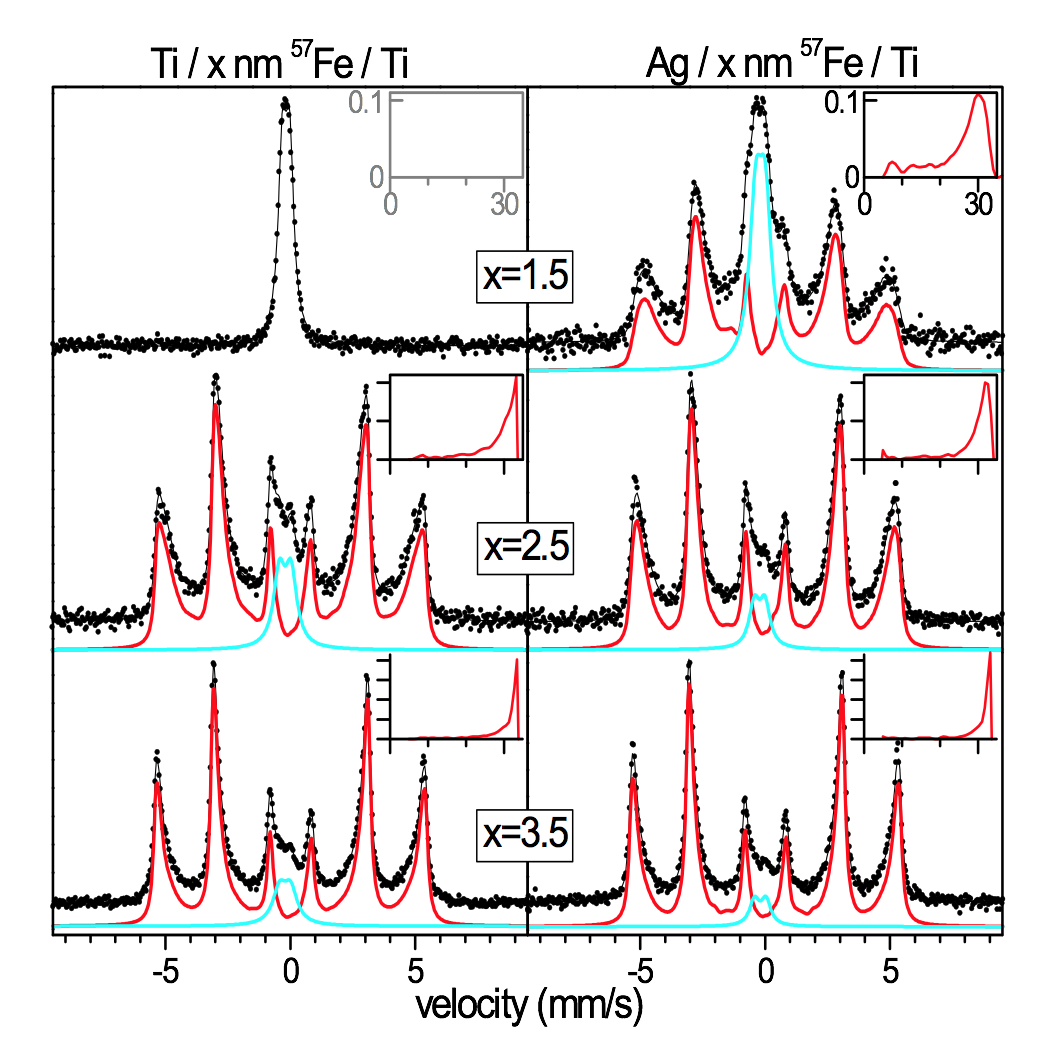
Figure 2. Room temperature Mössbauer spectra of Ti/57Fe/Ti and Ag/57Fe/Ti sample pairs with varying thickness of the 57Fe layer, as indicated in the figure. The sub-spectra belonging to paramagnetic amorphous alloy and ferromagnetic crystalline alloy components are indicated by blue and red lines, respectively.
From the Mössbauer results shown in Fig. 2 one can conclude that the bottom and the top interface of a Fe layer in between Ti layers are very different both in the extent and in the ratio of the amorphous and the crystalline alloys appearing at the interface. The Fe-on-Ti interface is about three times thicker than the Ti-on-Fe interface and the ratio of the Fe-rich bcc alloy is larger than that of the Ti-rich amorphous alloy. The Ti-rich amorphous alloy has a higher ratio than the crystalline alloy in the thin Ti-on-Fe interface, which probably does not form a continuous layer.
Surprisingly, the TEM experiments do not show the marked asymmetry of the Fe interfaces, probably due to the averaging of the signal across the specimen thickness in the view direction and a possible modest heating in spite of all the care taken during the sample thinning, but the XRR measurements also indicate a significant asymmetry. The fitted roughness values of 0.86 nm and 0.23 nm result in 2.0 and 0.54 nm “10-90” interface widths for the Fe-on-Ti and Ti-on-Fe interfaces, respectively. The scaling of the interface width may be model dependent, but a strong asymmetry of the Ti-on-Fe and the Fe-on-Ti interface widths is undoubtedly experimentally verified by the Mössbauer and the X-ray reflexivity (XRR) data. The TEM and XRR studies have been carried out in collaboration with the Peter Grünberg Institut, Forschungszentrum Jülich (Jülich, Germany).