2017
Hard X-ray spectroscopy is a powerful probe of the electronic and local atomic structure, combined with high penetration, element, orbital and spin selectivity. Here we report on experimental results and technical developments using X-ray probes in investigations of transformations of transition metal complexes. First, we demonstrate valance-to-core X-ray emission spectroscopy as a novel ultrafast probe with high chemical sensitivity. Second, we show that laboratory spectrometers can do more than has been expected, monitoring the concentration dependence of the Ni speciation in solution with X-ray absorption spectroscopy. Finally, we show the realization of total reciprocity violation in the phase for photon scattering.
Probing the dynamics of the valance electrons at a spin state in transition metal complexes. — Pump-probe experiments are powerful structural dynamics tools, which apply an ultrashort laser excitation pulse, and study the time evolution of the system with a probe pulse at chosen time delays. Unveiling the details of the relaxation processes that follow the light excitation can lead to a complete understanding of the involved mechanisms, which, for instance, shall promote the design of more efficient functional molecules. Here we report on experimental results and technical developments using an X-ray probe in time-resolved investigation of a transition metal complex that is a model system for molecular switches; the experimental work is aided by quantum chemistry. We probed the dynamics of valence electrons in photoexcited [Fe(terpy)2]2+ complex in aqueous solution to gain deeper insight into the electronic structure changes that lead to changes of the Fe-ligand bonds using hard X-ray emission spectroscopy (XES). A picosecond-time-resolved measurement of the complete 1s X-ray emission spectrum captures the transient photoinduced changes and includes the weak valence-to-core (vtc) emission lines that correspond to transitions from occupied valence orbitals to the nascent core-hole. As DFT-calculations predict (Fig. 1A), vtc-XES offers particular insight into the molecular orbitals directly involved in the light-driven dynamics. As the result of the excitation, antibonding orbitals are populated and the metal ligand orbital overlap becomes weaker, resulting in intensity reduction as well as energy shift in the experiment (Fig. 1C), in excellent agreement with our calculations (Fig. 1B). More subtle features at the highest energies reflect changes in the frontier orbital populations. The results are shown in Figure 1.
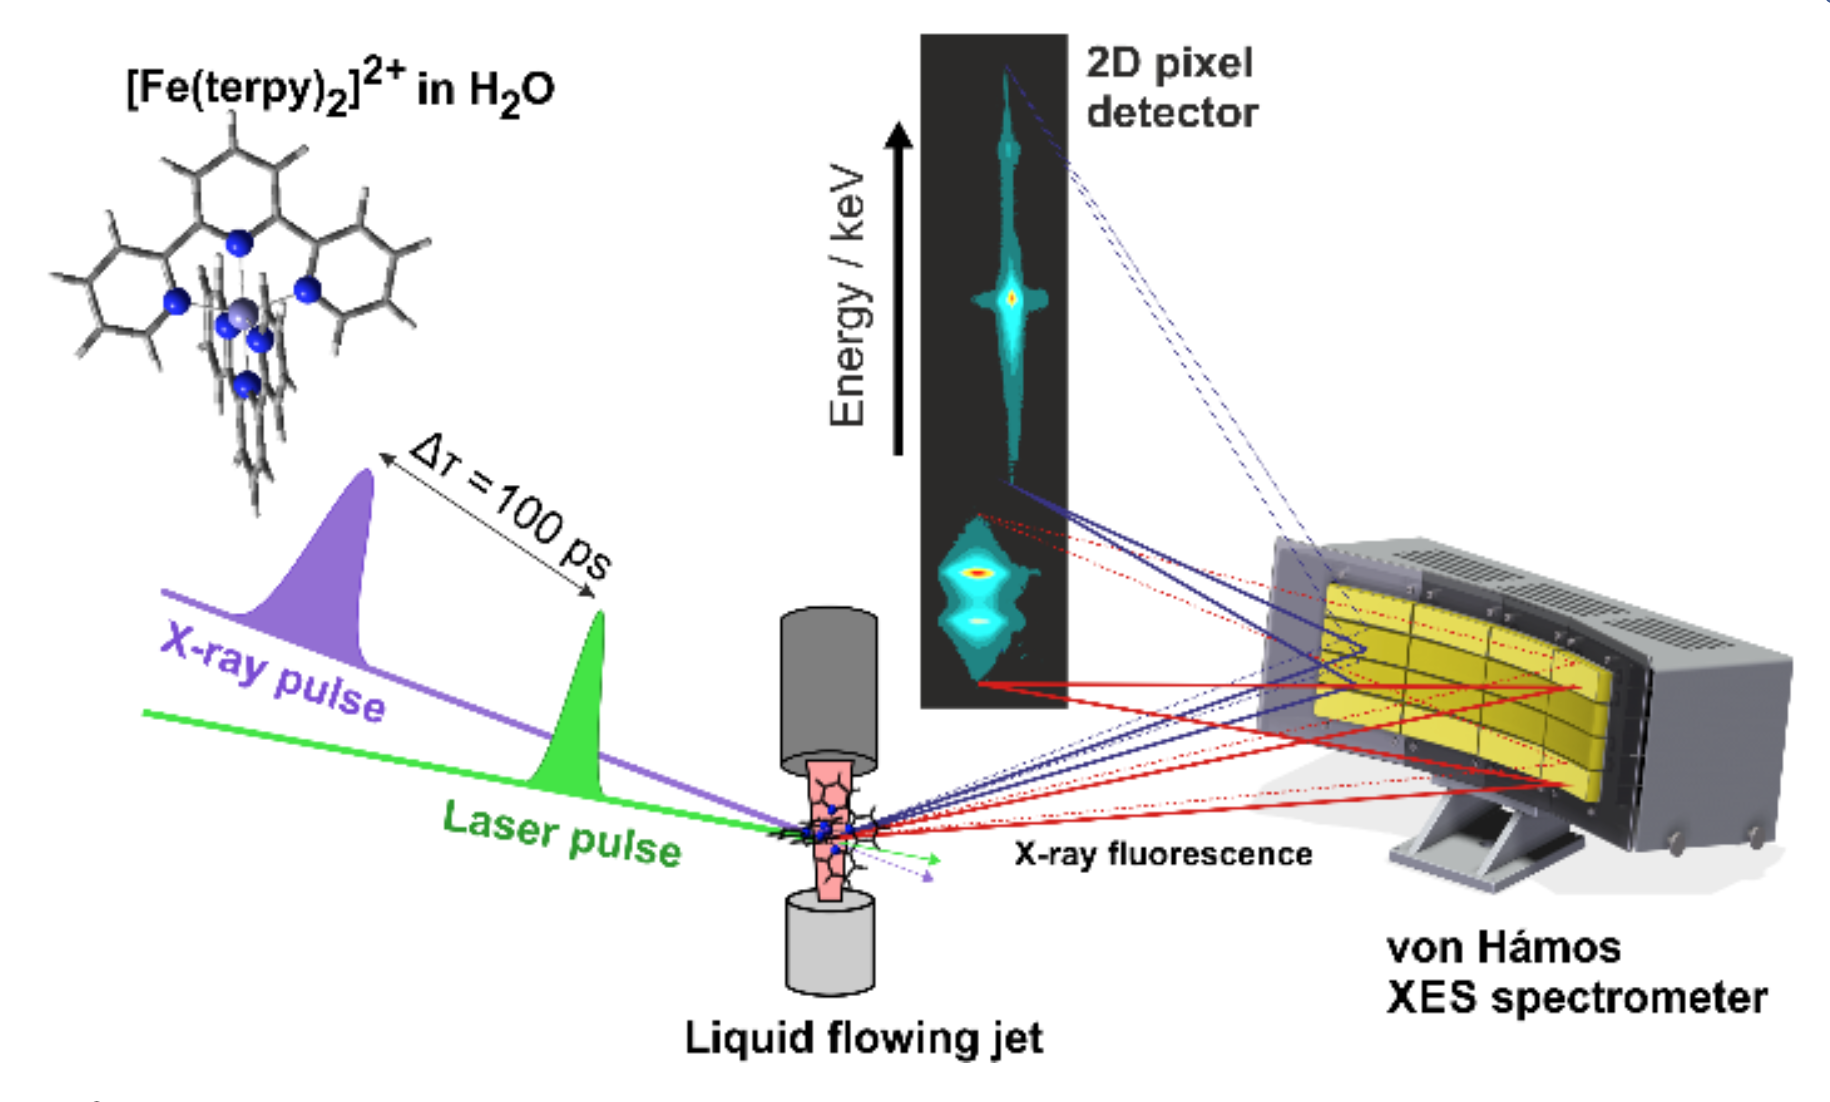
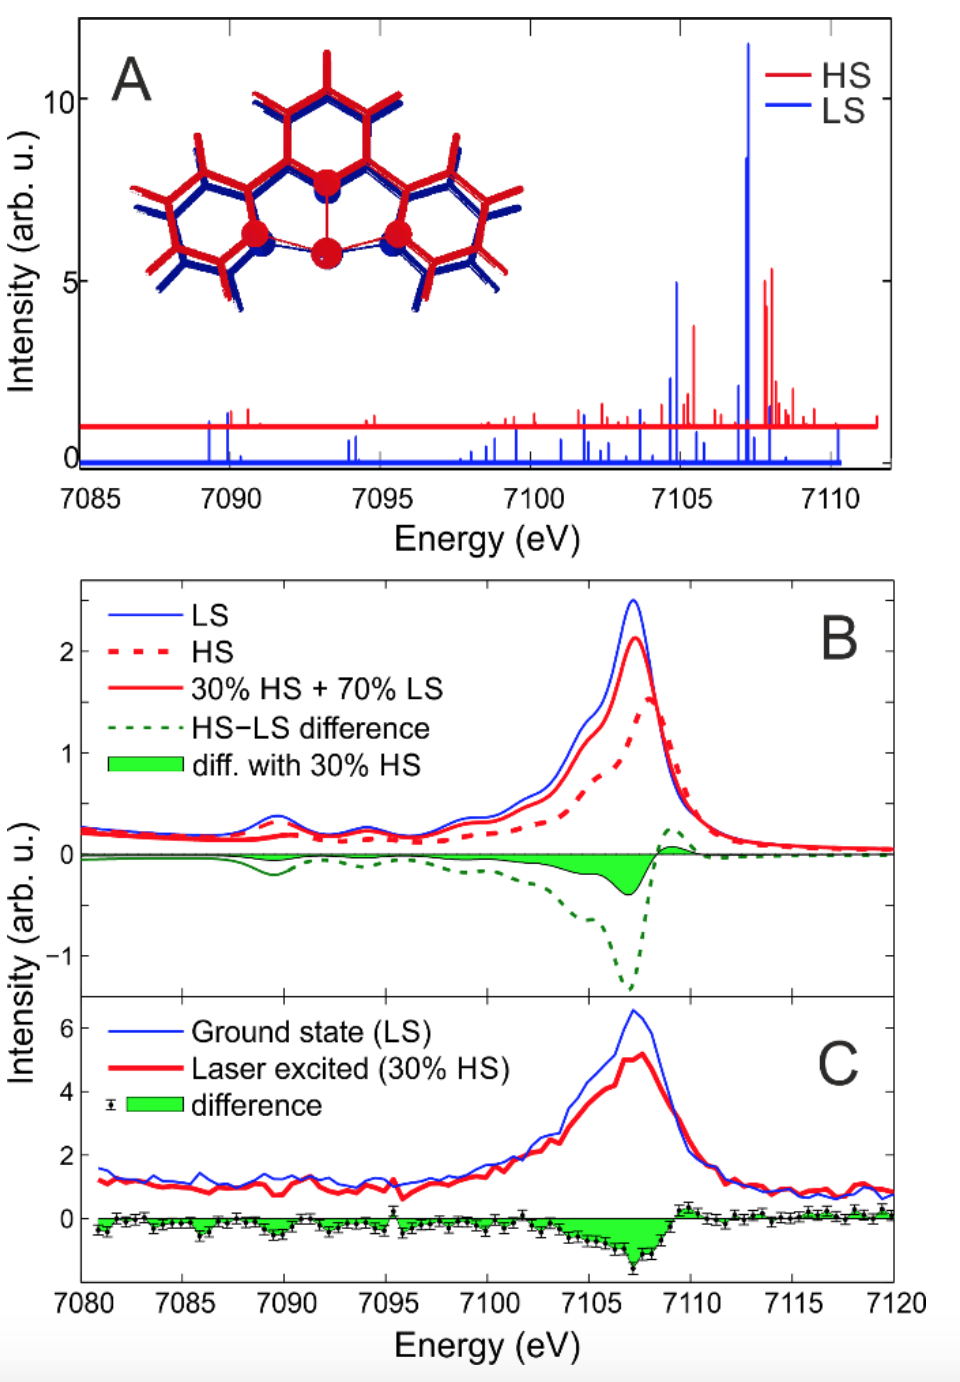
Figure 1 (top) The experimental setup showing the 16-crystal von Hamos spectrometer installed in a pump-probe geometry. Two different sets of 8 Si analyzer crystals were used to collect both Kα and Kβ plus vtc X-ray emission simultaneously. The detector image shown is a cropped actual frame from the pixel detector recorded during the experiment. On the left the molecular structure of the [Fe(terpy)2]2+ complex is shown. (A) Stick diagram of the molecular orbital contributions to the vtc-XES spectra of LS and HS [Fe(terpy)2]2+ (blue and red, respectively). The variation of the molecular structure is also shown on an iron with a single terpy ligand. Calculated (B) and measured (C) vtc-XES spectra of LS and HS [Fe(terpy)2]2+.
This result demonstrates the potential of vtc-XES as an ultrafast probe, which, combined with femtosecond time resolution in future experiments at X-ray free electron lasers, will shed more light on the intricate details of the elementary transition processes. (The full article can be accessed at http://dx.doi.org/10.1021/acs.jpcc.6b12940.)
Extending laboratory X-ray absorption spectroscopy for routine measurements in solution phase. — A novel laboratory von Hámos X-ray absorption spectrometer had been built and tested with solid samples the previous year by the group. This year the spectrometer was applied to obtain structural data on liquid samples, thereby widening the range of laboratory measurements that previously could only have been performed at synchrotron sources. We successfully demonstrated on the Ni2+ – EDTA – CN– ternary system that a complete speciation study can be performed from laboratory XANES (X-ray absorption near edge structure) measurement series, including the determination of the formation constants of the corresponding complexes. Moreover, the technique permits us to determine the local atomic structure around the Ni ion, with particular sensitivity to variations in symmetry. To best of our knowledge this is the first time that laboratory X-ray absorption spectroscopy was used for such a comprehensive study in solution.
The NiII−EDTA−CN− (EDTA = ethylenediaminetetraacetic acid) ternary system, in spite of its fairly simple components and numerous investigations, can have several molecular combinations, all of them not being identified unambiguously beforehand. In order to achieve a detailed understanding of the reaction steps and chemical equilibria, methods are required in which the structural transitions in the different reaction steps can be followed via element-selective complex spectral feature sets. While standard optical spectroscopies failed to excel in this task, with the help of our recently developed von Hámos type high energy resolution laboratory X-ray absorption spectrometer, both the structural variations and stability constants of the forming complexes were determined from the same measurement series.
Figure 2 outlines the main results of the study. Fig. 2A shows the FEFF9 calculated XANES spectra for the [NiEDTA]2−, [NiEDTA(CN)]3−, [Ni(CN)4]2−, and [Ni(CN)5]3− complexes (the inset shows the preedge region for each complex calculated via TD-DFT/TDA), which were expected to appear in the studied concentration ranges of the different constituents. Panel B shows the experimentally recorded spectra for a series of NiII−EDTA−CN− mixtures with different CN- concentrations. In the inset a significant change of the preedge features with a peak around 8336 eV can be observed, representing the formation of four- and/or five-coordinated nickel(II) complexes. From the relative areas of these preedge peaks, the ratio of the tetra- as well as the pentacyanide Ni complexes could be deduced, which is compared to literature based calculated distributions. Based on this distribution, the calculated XANES spectra for the measured samples could be reconstructed (panel D), which agree remarkably well with the experimental ones in panel B.
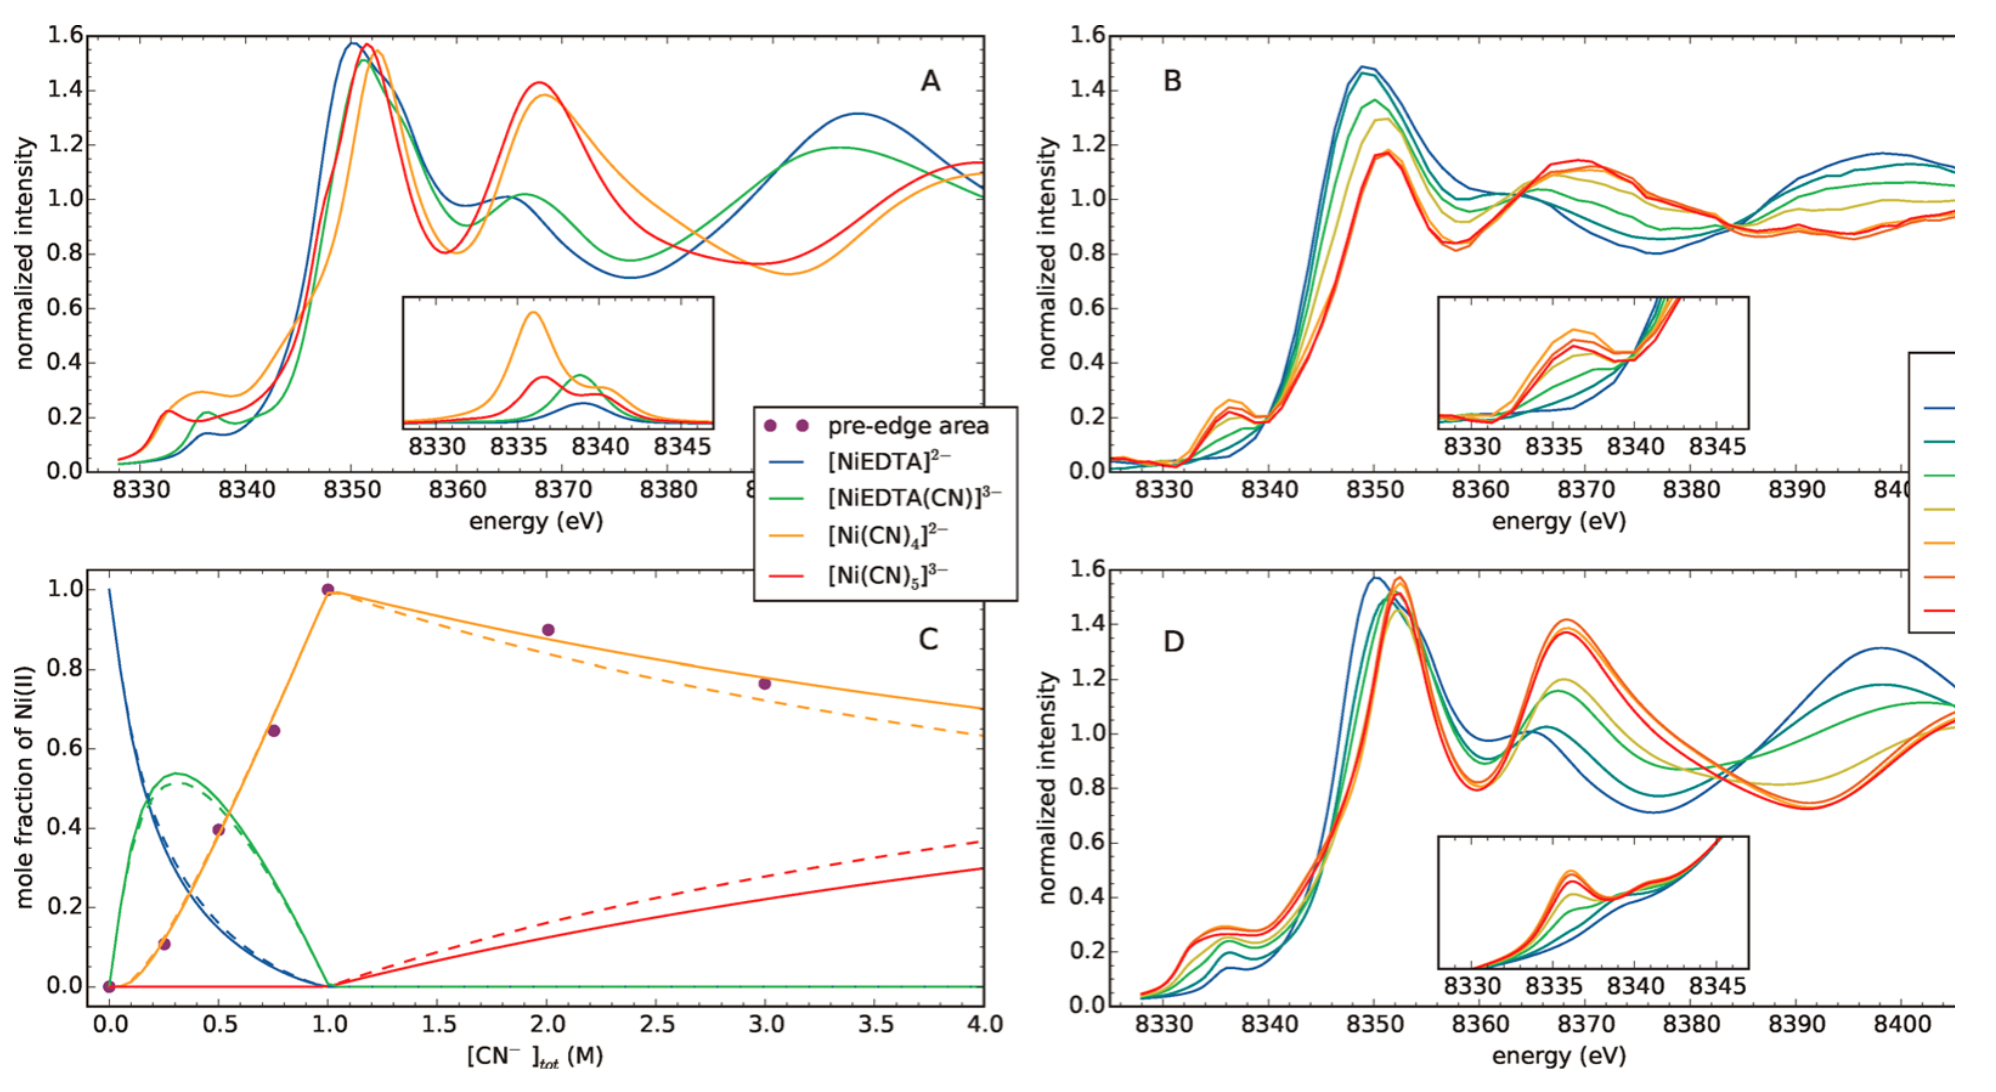
Figure 2. (A) Calculated XANES spectra of the four base complexes. (B) Laboratory XANES spectra of solutions containing constant 0.25 M NiCl2 and 0.30 M EDTA, while the concentration of the added KCN was varied between 0 and 3 M. (C) Distribution diagram of the following species: [NiEDTA]2− (blue), [NiEDTA(CN)]3− (green), [Ni(CN)4]2− (yellow), and [Ni(CN)5]3− (red). The dashed lines stand for the calculated-, the continuous ones for the XANES preedge fitted distributions. (D) Calculated XANES spectral series for the measured samples based on the determined nickel distribution shown in (C). (The full article can be accessed at http://dx.doi.org/10.1021/acs.inorgchem.7b02311.)
Realizing total reciprocity violation in the phase for photon scattering. — The reciprocity principle requires the scattering amplitude to be symmetric for the transposition of the detector and the source. While reciprocity involves the interchange of source and detector, it is fundamentally different from rotational invariance, and is a generalization of time reversal invariance, occurring in absorptive media as well. Reciprocity can be proved as a theorem in many situations and is found violated in other cases. For polarization dependent scatterings reciprocity is often violated, but violation in the phase of the scattering amplitude of X-ray photons oscillating in the attosecond range is much harder to experimentally observe than violation in magnitude.
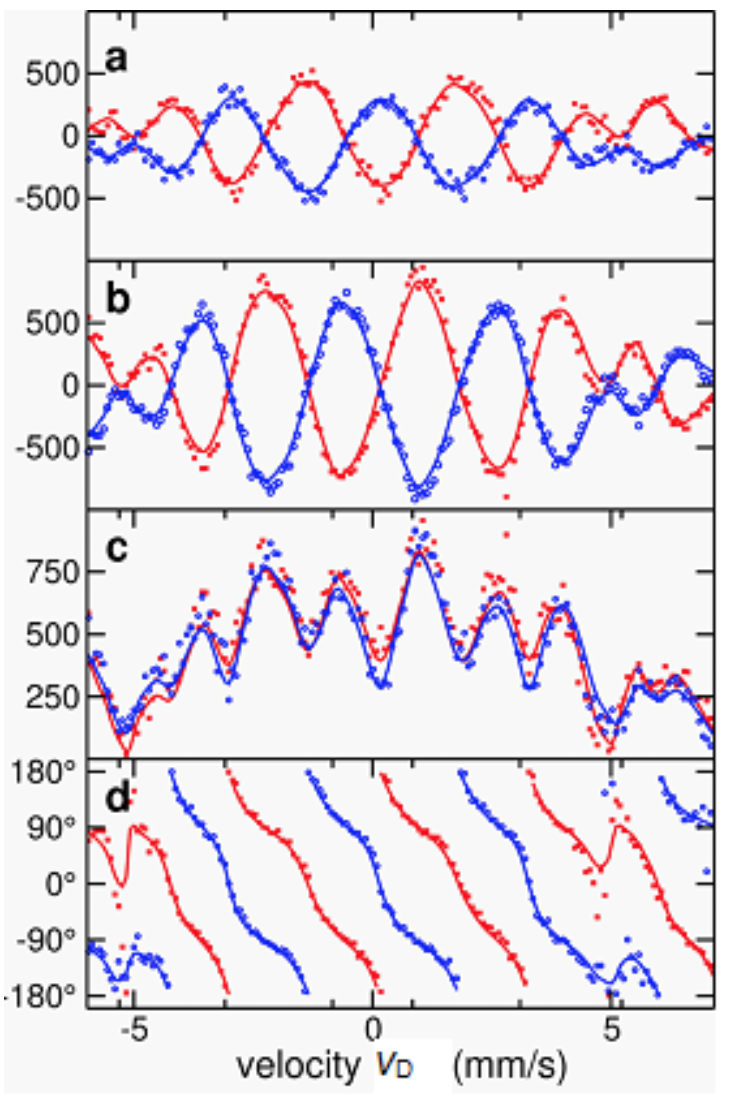
Figure 3. Real part (a), imaginary part (b), magnitude (c) and phase (d) of the complex scattering amplitude. The figure displays the range of the −1st order stroboscopic resonances; dots are experimental signals and continuous lines are theoretical simulations. The agreement between direct (red) and reciprocal (blue) data visible in (c) demonstrates magnitude reciprocity, while (d) shows maximal reciprocity violation in the phase (red and blue curves running with a 180° phase difference).
Enabled by the advantageous properties of nuclear resonance scattering of synchrotron radiation (SR), a maximal - i.e., 180-degree - reciprocity violation in the phase was found. For accessing phase information a new version of stroboscopic detection of nuclear resonance scattering of SR was developed. The scattering setting was devised based on a generalized reciprocity theorem that opens the way to construct new types of reciprocity related devices. The experiment realizing the direct and reciprocal scattering processes was performed at the High Resolution Dynamics Beamline P01 of the PETRA-III synchrotron source of the Deutsches Elektronen Synchrotron (DESY). The beam was scattered on a pair of 57Fe containing foils placed between a polarizer and an analyser, both having an extinction of 10−8, and was subsequently detected by a Si avalanche photo diode. One of foils was a single-line stainless steel absorber mounted on a Mössbauer drive, and the other foil produced the polarization dependent scattering as a result of being magnetic. Each of the six high-frequency and narrow nuclear resonance signals in the magnetic foil gets superposed and produces beats with the corresponding nearby frequency resonance signal in the reference foil. These lower frequency beats are not only more easily detectable but, thanks to the heterodyne setup, also tuneable by the Doppler shift of energy caused by the vD velocity of the Mössbauer drive. After a pulse, resonances decay as time passes, and one detects counts – essentially, intensity – as a function of time as well as of the drive velocity. This intensity gets multiplied, in the stroboscopic evaluation, by appropriate window functions and then integrated giving spectra shown in Fig. 3. The predicted 180° phase difference between direct and reciprocal data is apparent in Fig. 3d. (The full article can be accessed at http://dx.doi.org/10.1038/srep43114.)